
In September 2005, a web portal on cancer incidence and mortality in the Czech Republic was released with the primary objective to provide representative data on this topic. Providing relevant information on cancer epidemiology in the Czech Republic to foreign partners is another key objective of this project. Extensive information on cancer epidemiology in the Czech Republic is now available to anyone who wants to find out more about the situation in Czech regions, to compare Czech data with the foreign ones or to examine long-term incidence and mortality trends for individual cancers, for example.
The main objective of the SVOD project is to develop information systems supporting managerial decision-making and scientific analyses of population-based cancer data. Following these population-based data, any other data on risk factors for malignant tumours can be analyzed, including those on the state of the environment. Databases within the SVOD portal make accessible data of the Czech National Cancer Registry from 1977 onwards, thus representing a unique extent and volume of data. These data can be analyzed from the point of view of basic characteristics of patients or diagnosis information, and can be sorted both regionally and temporally. The information service of the portal is freely available to all users.
Analytical tools
- Incidence and mortality rates
- Time trends
- Age of patients
- Regional overviews
- Clinical stages
- Comparative analyses
- Comparison with foreign countries
- Summary presentations
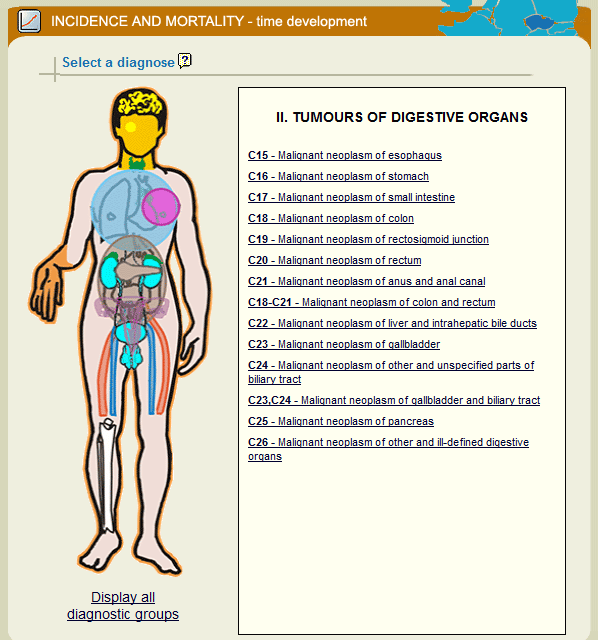
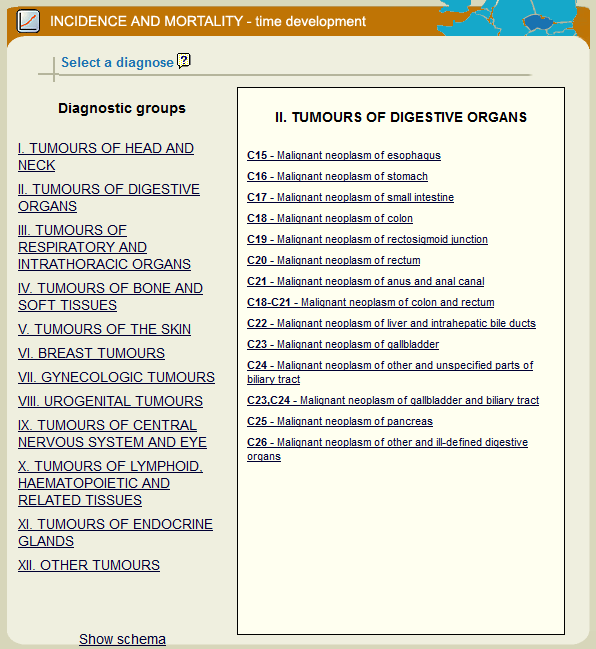
Epidemiological analyses are the most important part of the portal, involving 8 software tools that make it possible even for a lay user to get a basic picture of incidence and mortality rates in a selected cohort of cancer patients. The user can define a specific set of cancer patients and subsequently get a report containing basic graphic outputs supplemented with essential comments and a table with primary data. Selection of a specific diagnosis is always the first step when performing any analysis: individual diagnoses are classified into groups, and the desired group of diagnoses always appears in the right part of the window, after moving the mouse cursor over and clicking on a specific part of the human body (in case of the schematic diagram) or directly on the title of a specific group (in case of the list of diagnostic groups).
| Homepage of the SVOD portal | Selection of a diagnosis using the schematic diagram | Selection of a diagnosis using the list of diagnostic groups |
 |
 |
 |
The following paragraphs summarize the types and functionalities of available analytical tools.
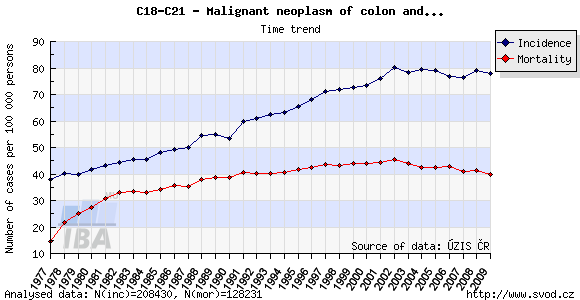
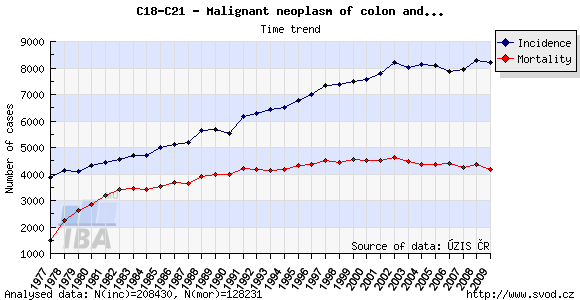
Tool No. 1: Incidence and mortality rates
This analysis makes it possible to examine time trends in incidence and mortality rates for a selected diagnosis. Values in graphs and tables can be displayed as:
- absolute numbers
- rate per 100,000 population (crude incidence rate, crude mortality rate)
- age-standardized (European) rate (ASR-E)
- age-standardized (world) rate (ASR-W)
Incidence and mortality curves can be displayed either individually or together.
| Incidence and mortality rates per 100,000 population | Incidence and mortality rates – absolute numbers |
 |
 |
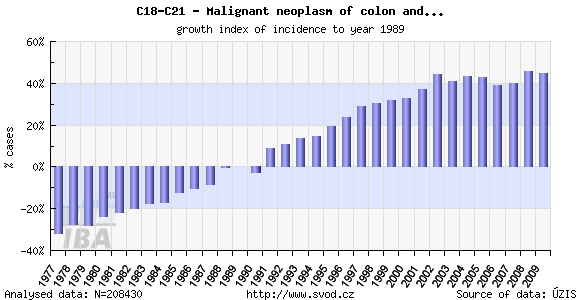
Tool No. 2: Time trends
These analyses make it possible to examine temporal changes in incidence and mortality rates. These changes can be displayed in relation to a specific year or as year-on-year changes. These outputs help the user to identify basic time trends and their major fluctuations. Values in graphs and tables can be displayed as:
- growth index of incidence/mortality rates in absolute numbers (calculated in relation to a selected year)
- growth index of incidence/mortality rates: percentage change (calculated in relation to a selected year)
- year-on-year change in absolute numbers
- year-on-year percentage change
| Growth index of incidence rate | Year-on-year percentage change |
 |
 |
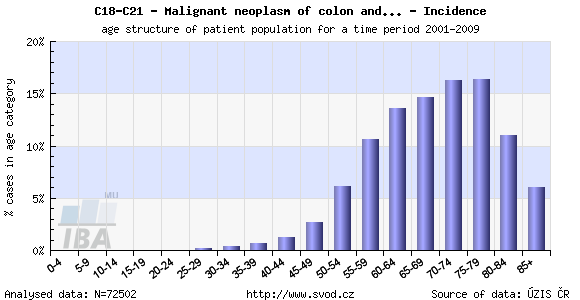
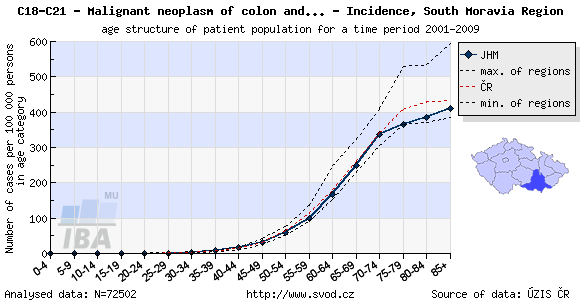
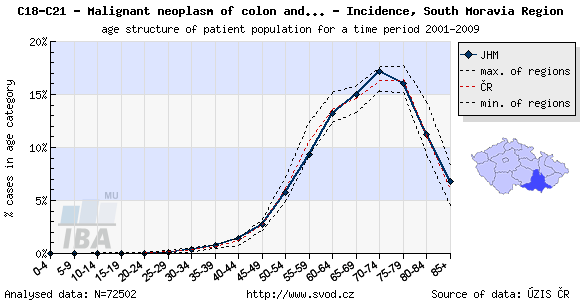
Tool No. 3: Age of patients
This analysis makes it possible to examine the age structure of cancer patients with a specific diagnosis or of those who died of a specific diagnosis. Values in graphs and tables can be displayed as:
- absolute numbers in age groups
- rate per 100,000 population in each age group (age-specific incidence rate, age-specific mortality rate)
- age structure – proportion of patients (in percents) sorted by age groups
| Age-specific incidence rate | Age structure of patients |
 |
 |
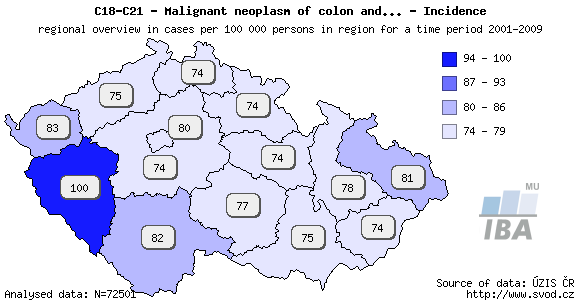
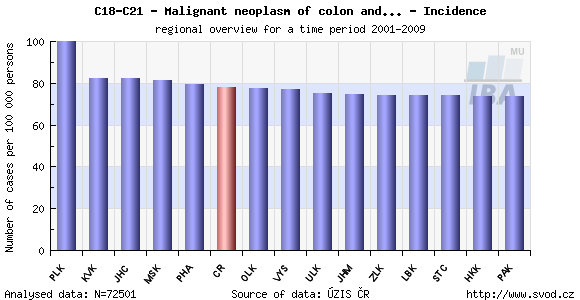
Tool No. 4: Regional overviews
This analysis makes it possible to compare incidence and mortality rates in individual Czech regions – displayed either on the map, or in a bar chart. Regions in the bar chart can be sorted in descending order according to the incidence/mortality rates. Values in graphs and tables can be displayed as:
- rate per 100,000 population (crude incidence rate, crude mortality rate)
- age-standardized (European) rate (ASR-E)
- age-standardized (world) rate (ASR-W)
| Regional overviews – map | Regional overviews – sorted bar chart |
 |
 |
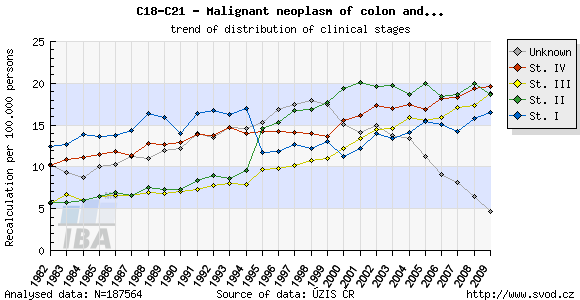
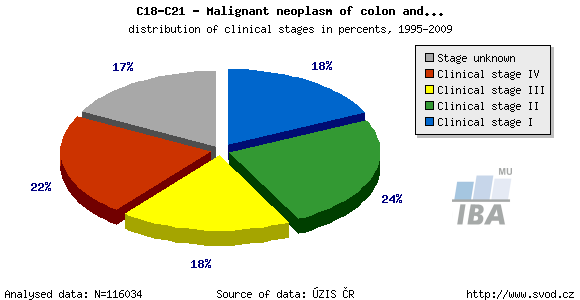
Tool No. 5: Clinical stages
This analysis makes it possible to examine the proportion of clinical stages for a selected diagnosis. The result can be displayed as a time trend in a proportional bar chart, as a time trend in a line graph, or overall for a selected time period in a pie chart. Values in graphs and tables can be displayed as:
- absolute numbers
- percentages
- rates per 100,000 population (crude incidence rate)
The values of clinical stages are based on the original primary data recorded in the database of the Czech National Cancer Registry (CNCR), and ouputs for individual diagnoses reflect the developments in TNM Classification of Malignant Tumours and their subsequent introduction into the CNCR. Namely, changes in TNM classification had the following impact on CNCR data:
- 1976-1981: TNM classification – 2nd edition (1974)
- 1982-1994: TNM classification – 3rd edition (1978)
- 1995-2000: TNM classification – 4th edition, 2nd revision (1994)
- 2001-2004: TNM classification – 5th edition (2000)
- from 2005 onwards: TNM classification – 6th edition (2004)
In the example below, diagnoses C18-C21 in the period 1977-1981 lack clinical stages I-IV as the TNM classification for these diagnoses was not available at that time.
| Proportion of clinical stages (time trend) | Clinical stages per 100,000 population (time trend) | Proportion of clinical stages over a selected period |
 |
 |
 |
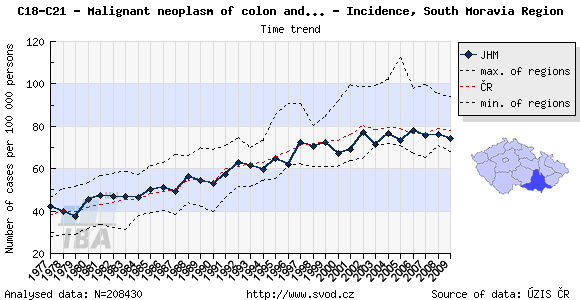
Tool No. 6: Comparative analyses
These analyses makes it possible to compare the situation in a selected region with that in the Czech Republic as a whole and with minimum and maximum values reported in individual Czech regions. The analyses can be performed in two basic modes:
- time trends in incidence or mortality rates, displayed as:
- rate per 100,000 population (crude incidence rate, crude mortality rate)
- age-standardized (European) rate (ASR-E)
- age-standardized (world) rate (ASR-W)
- age structure of cancer patients with a specific diagnosis or of those who died of a specific diagnosis, displayed as:
- rate per 100,000 population in each age group (age-specific incidence rate, age-specific mortality rate)
- age structure – proportion of patients (in percents) sorted by age groups
The region of interest can be easily selected by clicking on the map under the chart legend.
| Comparative analysis – time trend | Comparative analysis – age-specific incidence rate | Comparative analysis – age structure of patients |
 |
 |
 |
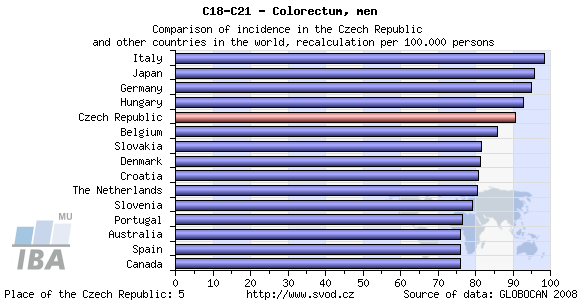
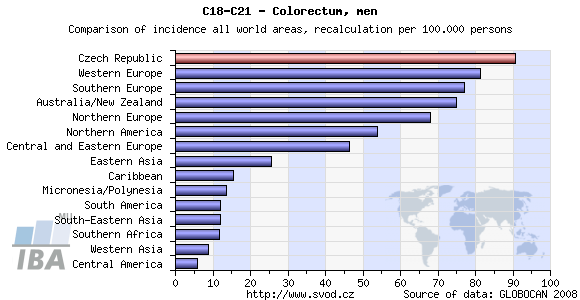
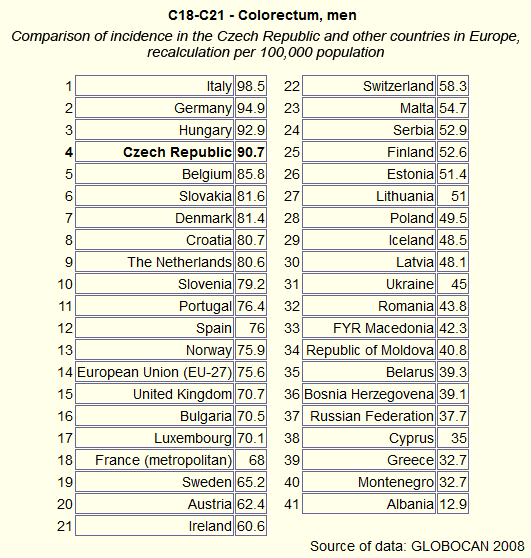
Tool No. 7: Comparison with foreign countries
This analysis makes it possible to compare cancer incidence/mortality rates in the Czech Republic with those in foreign countries. Compared values can be displayed as:
- absolute numbers
- rate per 100,000 population (crude incidence rate, crude mortality rate)
- age-standardized (world) rate (ASR-W)
Incidence and mortality rates of the Czech Republic can be compared to those of all countries of the world, those of European countries only, or those of world regions. For each diagnosis, the resulting chart provides the incidence/mortality rate of the Czech Republic and rates of 15 countries with the highest values, whereas the table contains values of all countries involved in the analysis (including those not displayed in the chart). The analysis can be performed separately for men, women, or the whole population. GLOBOCAN 2008 is the source of data for these analyses (due to limited possibilities of this source, the range of diagnoses offered in these analyses does not exactly correspond to the extent of the CNCR database).
|
Comparison with all countries of the world (chart)
|
Comparison with European countries (chart) |
 |
 |
| Comparison with world regions (chart) | Comparison with European countries (table) |
 |
 |
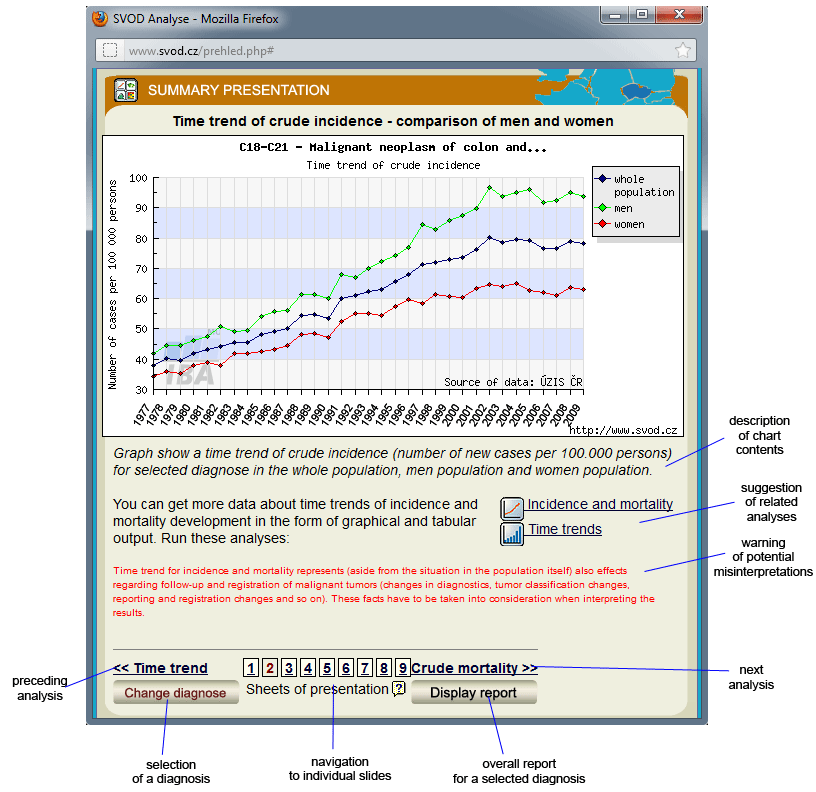
Tool No. 8: Summary presentations
A summary presentation provides an overview of basic epidemiological characteristics for a selected diagnosis. Each "slide" in the presentation involves specific comments and gives access to other analytical tools. The summary presentation involves the following analyses:
- time trends in crude incidence and mortality rates
- time trends in crude incidence rates – a comparison of men and women
- time trends in crude mortality rates – a comparison of men and women
- time trend in the mortality to incidence ratio – a comparison of men and women
- age structure of patients who died of a specific diagnosis
- age-specific incidence and mortality rates
- regional overview – crude incidence rate (map)
- regional overview – crude mortality rate (map)
- time trend in the proportion of clinical stages
Individual analyses can be viewed directly by clicking on a number in the lower part of the window.
Summary presentation providing comments, access to other analytical tools and navigation to individual slides
| Link | Date | Availability [?] | Clinically sensitive [?] | Licence | |
|---|---|---|---|---|---|
| Cancer Epidemiology in the Czech Republic | 4.6.2012 | anyone | – |  |
4-D assessment:
Textbooks and manuals |
Educational websites and atlases |
Digital video |
Presentations and animations |
Casuistics in images |
E-learning courses (LMS) |
Unreviewed |
Undergraduate level |
Graduate |
Advanced Graduated |
Complex |
HodnoceníPlease select achieved education degree and then evaluate the teaching material particularly in light of material suitability for self-learning.
Student – student of bachelor or master degree
Graduate – graduate of bachelor or master degree PhD. Graduate – Ph.D. student, Ph.D. graduate, researcher, ...
%
Evaluate evaluatethis contribution first! |
 Contribution content is subject to licence Creative Commons Uveďte autora-Neužívejte dílo komerčně-Nezasahujte do díla Attribution 3.0 Czech Republic
Keywords: cancer epidemiology, incidence rates, mortality rates, comparison with foreign countries
citation: Ladislav Dušek, Jan Mužík, Miroslav Kubásek, Jana Koptíková, Jan Žaloudík, Rostislav Vyzula: Epidemiology of malignant tumours in the Czech Republic. Multimedia support in the education of clinical and health care disciplines :: Portal of MU’s Faculty of Medicine [online] , [cit. 19. 05. 2025]. Available from WWW: https://portal.med.muni.cz/article-584-epidemiology-of-malignant-tumours-in-the-czech-republic.html. ISSN 1801-6103.